DORA Metrics: Why They Matter and How to Measure Them
- 5 minsIntroduction: Why DORA Metrics Matter
Today’s engineering teams are under more pressure than ever to deliver software rapidly—without compromising on stability or quality. Shipping features quickly is important, but not if it leads to outages, frustrated users, or developer burnout.
Traditional productivity metrics—like the number of tickets closed or lines of code written—offer little insight into the true health and efficiency of a software delivery process. That’s where DORA metrics come in.
Developed by Google’s DevOps Research and Assessment (DORA) team, these four metrics have become the industry standard for assessing and improving engineering performance. DORA metrics go beyond surface-level activity; they tie engineering efforts directly to business outcomes such as customer satisfaction, product reliability, and team efficiency.
In this guide, we’ll break down the four DORA metrics, explain how to measure them, and share practical tips to ensure accurate tracking and meaningful improvement.
The 4 Key DORA Metrics
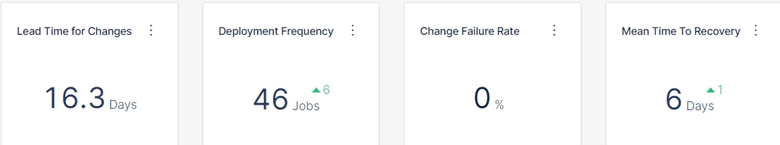
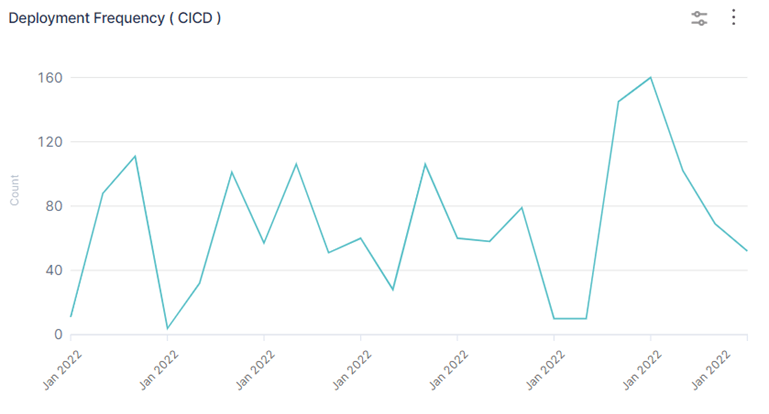
1. Deployment Frequency
How often does your team deploy code to production?
Why it matters: High deployment frequency means your team is releasing smaller, more manageable changes, resulting in lower risk, faster feedback, and a culture of continuous improvement.
Example:
Team Alpha deploys multiple times per day, enabling quick delivery of new features and fast bug fixes. In contrast, Team Beta deploys once a month, leading to larger releases, more risk, and greater deployment stress.
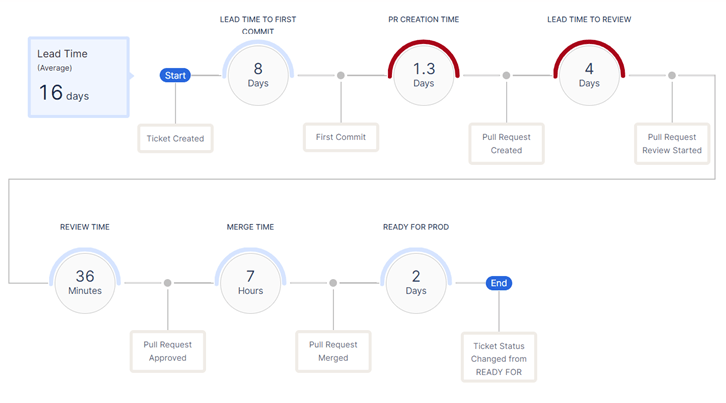
2. Lead Time for Changes
The time it takes for a code change to move from commit to production.
Why it matters: Short lead times allow teams to deliver value to customers quickly and react promptly to feedback or incidents. Long lead times slow innovation and make it difficult to address issues in a timely manner.
Example:
An e-commerce platform with short lead times can launch new features or resolve critical bugs in hours, not weeks, giving it a competitive edge.
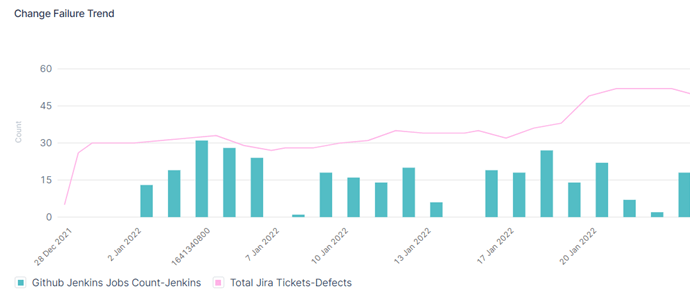
3. Change Failure Rate
The percentage of deployments that cause a failure in production.
Why it matters: A low change failure rate demonstrates that your team can deploy frequently with confidence, while a high failure rate indicates the need for better testing, review, or deployment practices.
Example:
If a team deploys 20 times in a week and one deployment results in a production incident or requires a hotfix, the change failure rate is 5%. A higher rate signals a need to review deployment and quality assurance processes.
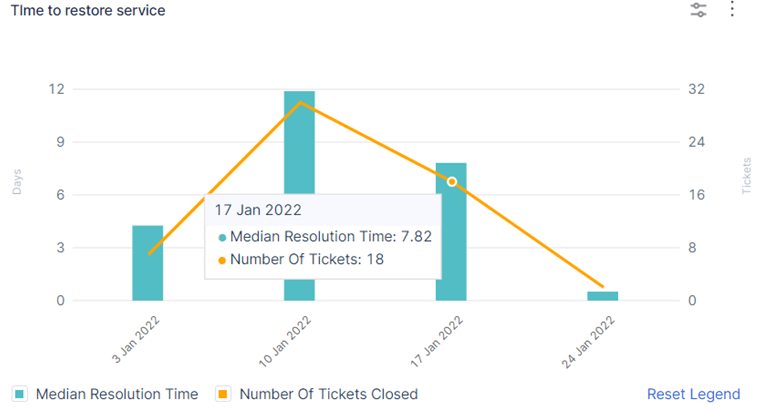
4. Mean Time to Recovery (MTTR)
The average time it takes to restore service when a production incident occurs.
Why it matters: Rapid recovery minimizes user impact and maintains customer trust. MTTR reflects a team’s ability to detect, respond to, and resolve incidents quickly.
Example:
Team Alpha typically resolves incidents in under 10 minutes, ensuring minimal disruption. Team Beta takes several hours, which increases user frustration and potential business impact.
How to Measure DORA Metrics
Deployment Frequency
-
How to measure: Count the number of successful production deployments over a given period (e.g., per day, week, or month).
-
Formula:
Deployment Frequency = Number of Production Deployments / Time Period -
Best practice: Exclude non-production deployments from this metric.
Lead Time for Changes
-
How to measure: Track the duration from the time a commit is made (or a pull request is merged) to when that change is deployed to production.
-
Formula:
Lead Time = Production Deployment Time – Commit Time -
Example: Commit at 10:00 AM, deployed at 2:00 PM = 4 hours lead time.
-
Best practice: For batch deployments, use the timestamp of the last commit included in the deployment or calculate an average across all changes.
Change Failure Rate
-
How to measure:
Change Failure Rate = (Number of Failed Deployments / Total Deployments) × 100 -
What to count: A “failure” is any deployment that results in a production incident, rollback, or emergency hotfix.
-
Best practice: Maintain a clear and consistent incident tracking process to ensure accurate reporting.
Mean Time to Recovery (MTTR)
-
How to measure:
MTTR = Total Incident Recovery Time / Number of Incidents -
Example: If three incidents are resolved in 15, 30, and 60 minutes, the MTTR is (15+30+60)/3 = 35 minutes.
-
Best practice: Be aware of outliers—long-running incidents can skew the average and should be reviewed separately.
Common Measurement Challenges
-
CI/CD “Noise”: Ensure only production deployments are counted.
-
Development Process: Define clearly what constitutes a deployment in your workflow.
-
Data Quality: Incomplete or inconsistent tracking of deployments and incidents will reduce the value of your metrics.
-
Incident Definition: Establish a shared understanding of what counts as a production failure across your team.
Conclusion: When and How to Get Started
When to start measuring:
Begin tracking DORA metrics as soon as your team has regular production deployments and some way to track incidents—even if the process is manual at first. Early measurement provides a baseline and helps drive continuous improvement.
Tips for Success:
-
Focus on long-term trends, not one-off numbers.
-
Use DORA metrics to identify bottlenecks and opportunities, not to assign blame.
-
Avoid vanity metrics—high deployment frequency is only valuable if matched by low failure rates and fast recovery.
Next Steps:
-
Start with simple, manual tracking and review your metrics regularly.
-
As your team grows, consider automated solutions like Harness Software Engineering Insights, which can unify your DORA metrics, automate tracking across your entire SDLC, and provide actionable insights out of the box.
-
Try open-source tools like Google’s Four Keys or DORA dashboards in your CI/CD platform.
DORA metrics provide a proven framework for aligning software delivery with organizational goals. By tracking and improving these metrics, engineering teams can deliver better software faster—benefiting developers, customers, and the business as a whole.

Shubhendra Singh Chauhan
Dev 🥑 | Open-Source & Community 💖 | Mozilla Rep | Curating ossbytes.dev 📩